In vitro pharmacology: receptor antagonism
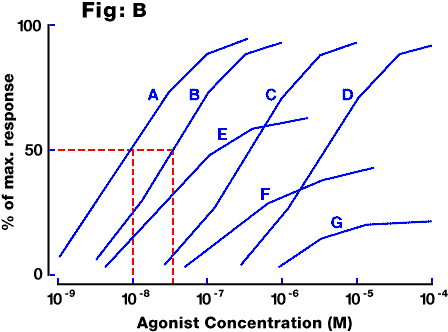
Fig. B: Idealised concentration-response curves for an agonist under control conditions (curve A) and in the presence of three concentrations of a competitive antagonist (curves B,C,D, representing 10-fold increases in antagonist concentration each time). Note that a competitive antagonist does not depress the maximum response to the agonist, whereas an unsurmountable antagonist would do so (curves E,F,G).

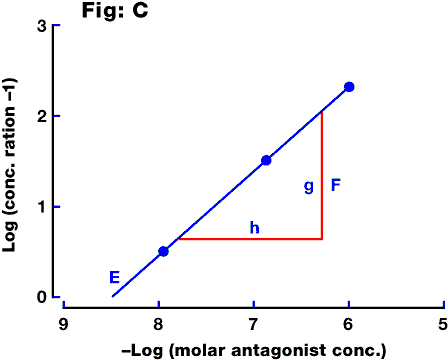
Fig. C: Schild plot derived from the above data, by plotting log(concentration ratio - 1) on the y axis against the log of the antagonist concentration on the x axis. The intercept (E) represents the pA2 value for the antagonist, and the significance of the slope (F, representing g/h) is discussed in the text (see Schild slope).
Affinity constant
See KB.
Concentration ratio
Concentration of agonist producing a defined response (usually but not necessarily 50% of
maximum) in the presence of an antagonist, divided by the concentration producing the same
response in the absence of antagonist. In figure B above
the concentration ratio for curve B relative to control curve A is equal to the EC50 for curve B divided by the EC50 for
curve A, i.e. 3x10(-8) / 1x10(-8) = 3.
Dose-ratio
Term familiarly applied to concentration ratio.
Gaddum equation
See pKB.
KB
The dissociation equilibrium constant for a competitive antagonist; the concentration
which would occupy 50% of the receptors at equilibrium. The reciprocal is called the
affinity constant or the association constant.
Negative efficacy (or negative antagonist)
See inverse agonist.
pA2
A logarithmic measure of the potency of an antagonist;
the negative log of the concentration of antagonist which would produce a 2-fold shift in
the concentration-response curve for an agonist. It is calculated by extrapolating the
line on a Schild plot to zero on the y-axis. If the slope of the Schild plot is not
exactly 1, but does not differ significantly from it, some authorities prefer to constrain
the slope of the line to 1 in calculating an estimated pA2 value (see fig. 1c
in Jenkinson (1991)). This pA2 value then equates to the pKB value.
pKB
A measure of the potency of a competitive antagonist; the negative log of the molar
concentration which at equilibrium would occupy 50% of the receptors in the absence of
agonist. In an experiment in which a single concentration of antagonist has caused a
parallel shift of the agonist concentration-response curve, the pKB value can
be calculated using the Gaddum equation:
pkB = log(conc.ratio - 1) - log(antagonist conc.)
For a competitive antagonist (i.e. one where the slope of the Schild plot equals 1), the pKB is theoretically equal to the pA2 value. In practice, there may be some discrepancy. The pKB value should also be equal to the pKi value for the compound determined in a binding assay, although there may again be a discrepancy caused by the use of different media, etc.
Schild analysis
Calculation of the potency of competitive antagonists according to the method of
Arunlakshana and Schild (1959) This is a null method, i.e. it makes no assumptions about
the nature of the coupling between receptor binding and the response, but simply assumes
that any particular level of response is associated with a unique degree of occupation and
activation of the receptors by the agonist. There are a number of other assumptions and
criteria, the most important of which are that (a) the agonist acts only at a single
receptor type; (b) the binding of both agonist and antagonist is competitive and
reversible; (c) responses are measured when both agonist and antagonist are at equilibrium
with the receptors; and (d) the antagonist causes parallel rightward shifts of the log
agonist concentration-response curve with no depression of the maximum response. See Schild plot and Schild slope.
Schild equation
The equation:
(conc. ratio - 1) = (antagonist conc.)/KB
where conc. ratio = concentration ratio for the agonist (see above) and KB = dissociation equilibrium constant for the antagonist. The Gaddum equation (see pKB) is the logarithmic transformation of this equation.
Schild plot
A graph of log (concentration ratio - 1) against log (antagonist concentration). An
example is shown in Fig. C. The intercept on the log
concentration axis is equal to the pA2 value, while the slope gives information
about the nature of the antagonism.
Schild slope
The slope of a Schild plot should equal 1 if all of the assumptions underlying the method
of analysis are fulfilled. A slope which is significantly greater than 1 may indicate
positive cooperativity in the binding of the antagonist, depletion of a potent antagonist
from the medium by receptor binding or non-specific binding (e.g. to glassware or
partitioning into lipid), or lack of antagonist equilibrium. A slope which is
significantly less than 1 may indicate negative cooperativity in the binding, or removal
of agonist by a saturable uptake process, or it may arise because the agonist is acting at
a second receptor type (this can also cause curved Schild plots). There are many other
reasons why slopse differ from the theoretical value, but most of them are difficult to
prove. See Kenakin (1987) for a thorough discussion. If the slope of a Schild plot is
greater than 1, the calculated pA2 value will be an underestimate of the pKB value (i.e. the antagonist is less potent than
expected). Conversely, if the slope is less than 1, the calculated pA2 value
will overestimate the pKB value.
![]() References
References
![]() Concentration-response
curves
Concentration-response
curves
![]() Table of Contents
Table of Contents
 |
 |
 |
 |
 |
 |
 |
